%20(26).png?width=2000&height=1125&name=CSS%20-%20Blog%20(Featured%20Images)%20(26).png)


Every Cloud Storage Security (CSS) customer has access to a variety of reports within the CSS console, many of which can be exported to CSV, sent to the security information and event management (SIEM) technology of your choice, such as Splunk, and integrated with other solutions such as AWS Security Hub.
A wide array of information is readily available for monitoring and reporting purposes, including:
- Notifications: Tracks and notifies on key events that happen within the deployment, including (but not limited to) new resources discovered, if a bucket has public access, classification results, and low prepaid data available.
- Proactive Notifications: notifies users of important activity that occurs within their account, including (but not limited to) scan results, Job activity, Resources discovered, Resources protected, Security findings, and low prepaid data available.
- Storage Assessment: when enabled, provides key details and trends about the data being stored within Amazon S3.
- Scan Results: provides a breakdown by day/week/month of the data scanned in the account and the result of those scans. This can be viewed at a summary level, by AWS account, or by resource type (S3 bucket, FSx Volume, etc.)
- Usage: shows the amount of data scanned by type (event-based, retro, API), broken down by Groups or Accounts.
- Job Monitoring: provides real-time updates as we scan and process your data, including details about what was scanned, the results, as well as errors and other problems encountered while running the job.
Let's dig into more detail.
The Dashboard
The Dashboard page is your window into your malware scanning and data classification status. It offers a quick look into the total volume and count of data and objects scanned, the number of problem files or classification results discovered during scanning, and the protection status of buckets and volumes across your accounts.
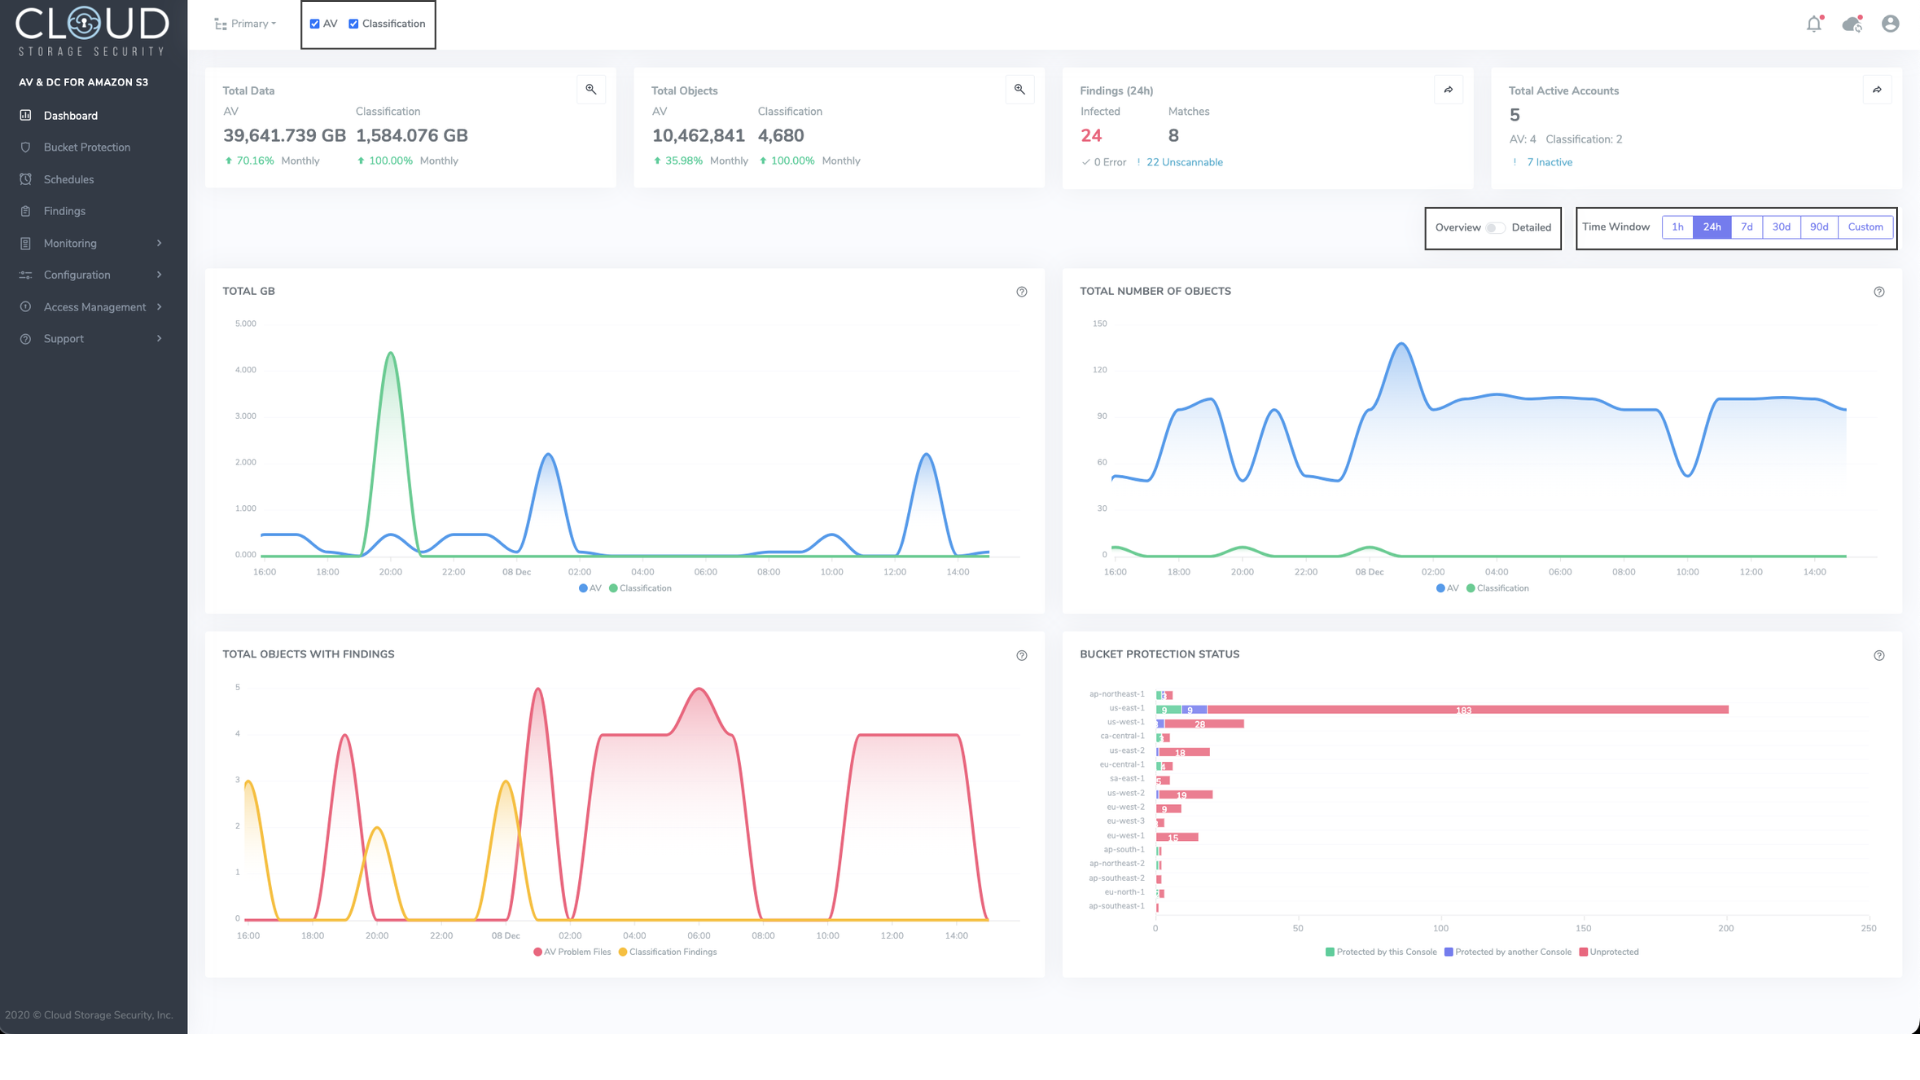
Figure 1. Dashboard in CSS console when both antivirus and data classification solutions are in use.
The data displayed on the dashboard can be filtered in a number of ways. At the top of the screen, users can choose whether the data are pulled from antivirus, data classification, or both. The time window can be adjusted by selecting an option from the “Time Window” pane located below the top row of widgets. More detailed information, including the amount of GBs scanned with each scan model or the specific finding (AV infected, AV unscannable, classification matching) can be surfaced by toggling the switch next to the “Time Window” pane to “Detailed”.
Scan Results
The Results page may have a different name in the navigation menu, depending on which CSS solutions you are currently using:
- AV: AV Results
- DC: Classification Results
- AV and DC: Results
The Scan Results page allows customers to view the performance of their scanning agents over time at varying levels of granularity down to the object level.
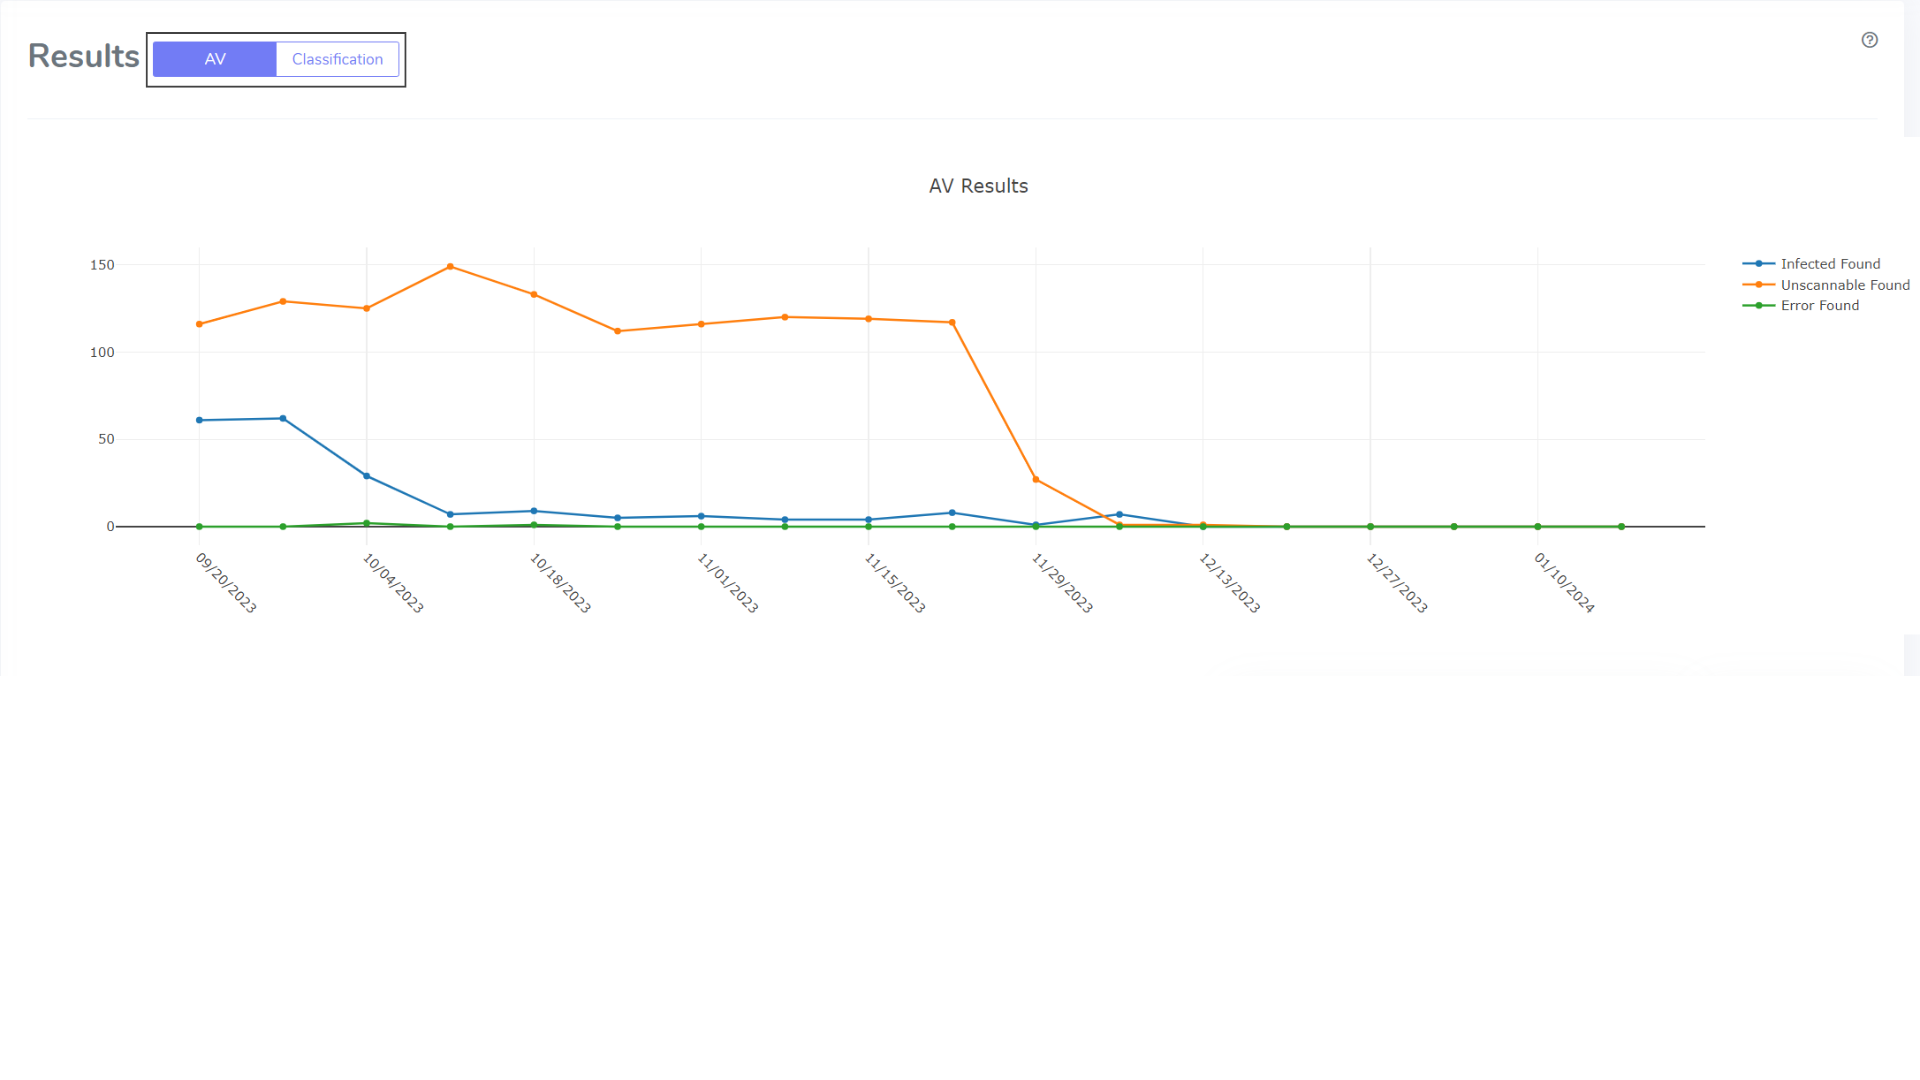
Figure 2. Scan results chart in CSS console.
The scan results chart displays either antivirus or data classification results with separate metrics for files found to be infected, unscannable, or have an error.
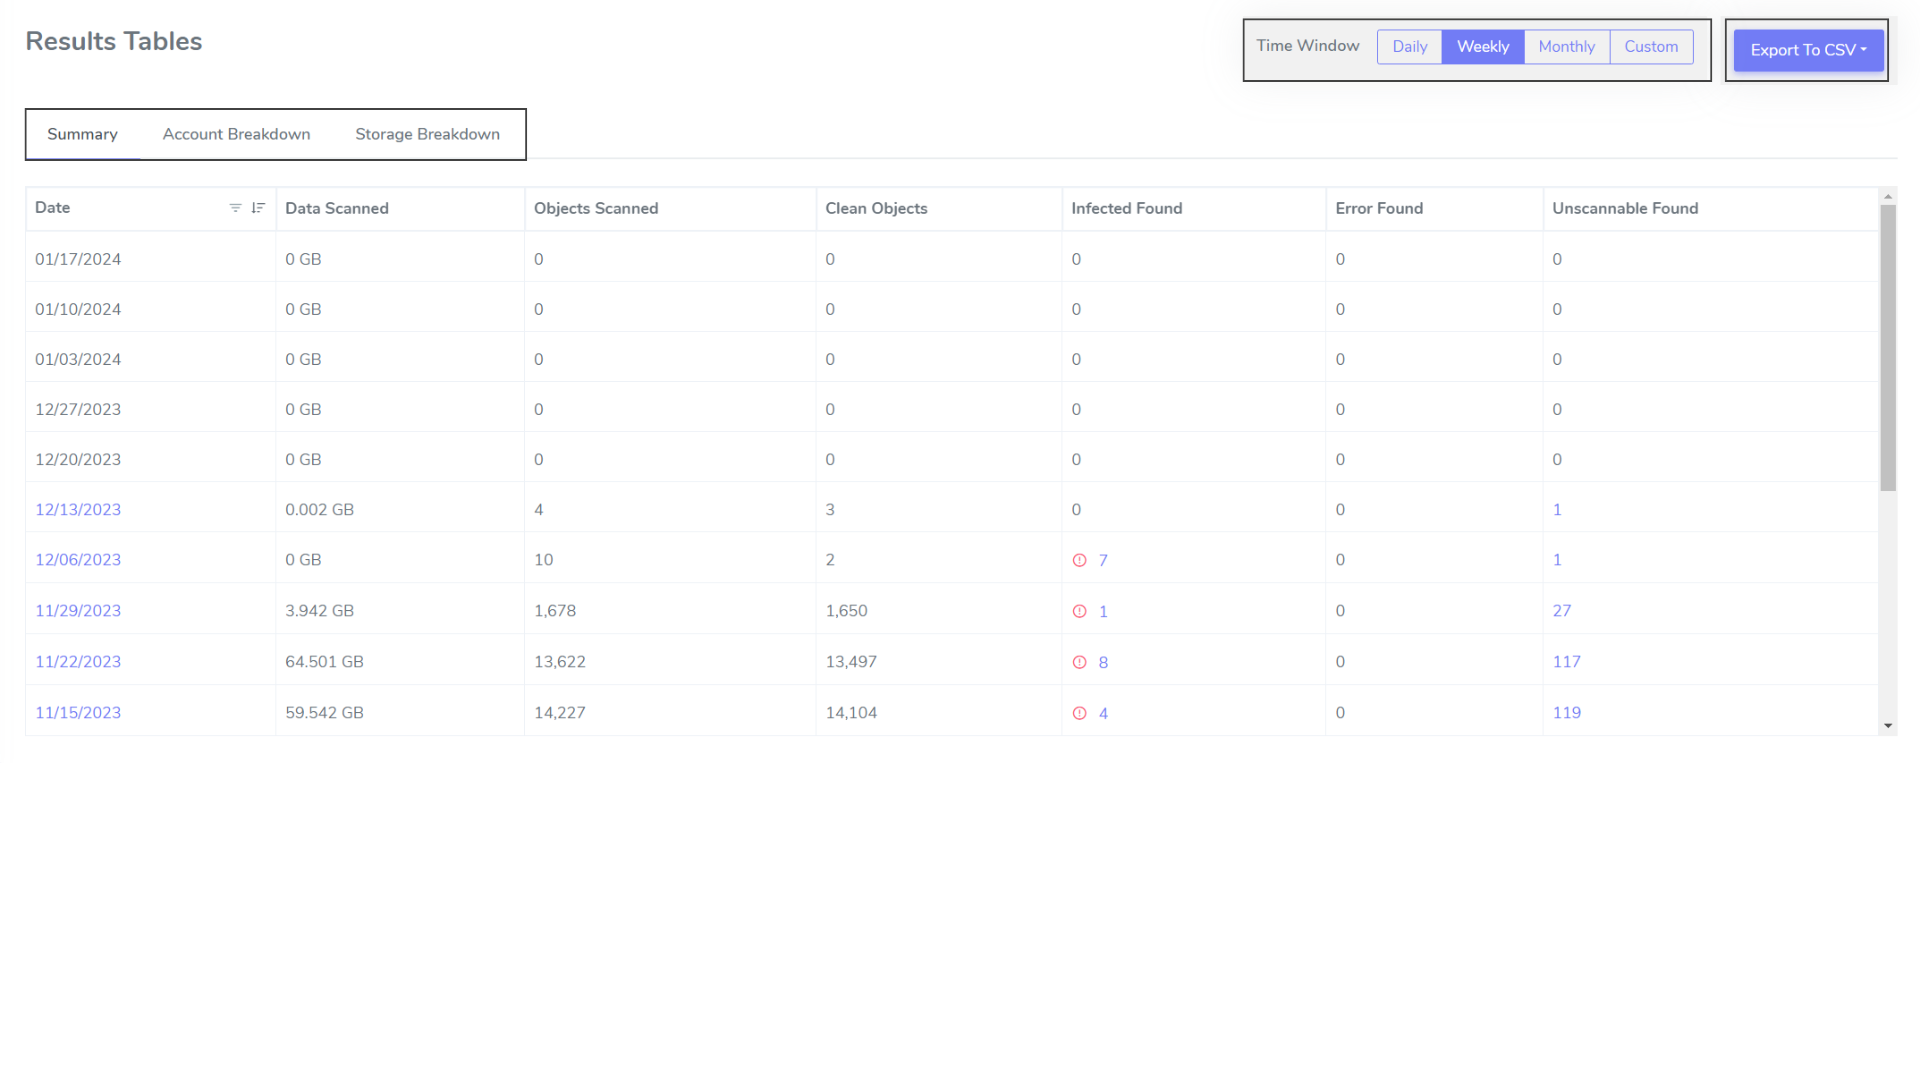
Figure 3. Scan results table in CSS console.
Below the scan results chart are the results tables, which provides users with three categories that can be changed with the buttons below the “Results Tables” chart title:
- Summary: Displays the amount of data and objects scanned as well as the number of objects found to be clean, infected, unscannable, or have an error across all accounts, groups and storage types. To view more information about the scanning or about any infected, error, or unscannable files, click on the respective hyperlinked result, which will bring you to the Problem Files page for further analysis.
- Account Breakdown: Displays the amount of data and objects scanned as well as scan results per account and per group.
- Storage Breakdown: Displays the amount of data and objects scanned as well as scan results within each scanned Amazon S3 bucket or Amazon EBS/EFS/FSx volume.
The entire Monitoring > Results page can be filtered by time period (daily, weekly, monthly, or custom) by choosing a time period in the pane below the scan results chart.
The data within these charts can be exported to .csv format by using the "Export to CSV" button to the right of the "Time Window" pane.
Usage
The Monitoring > Usage page allows customers to view the total amount of antivirus or classification usage broken down by either groups or accounts.
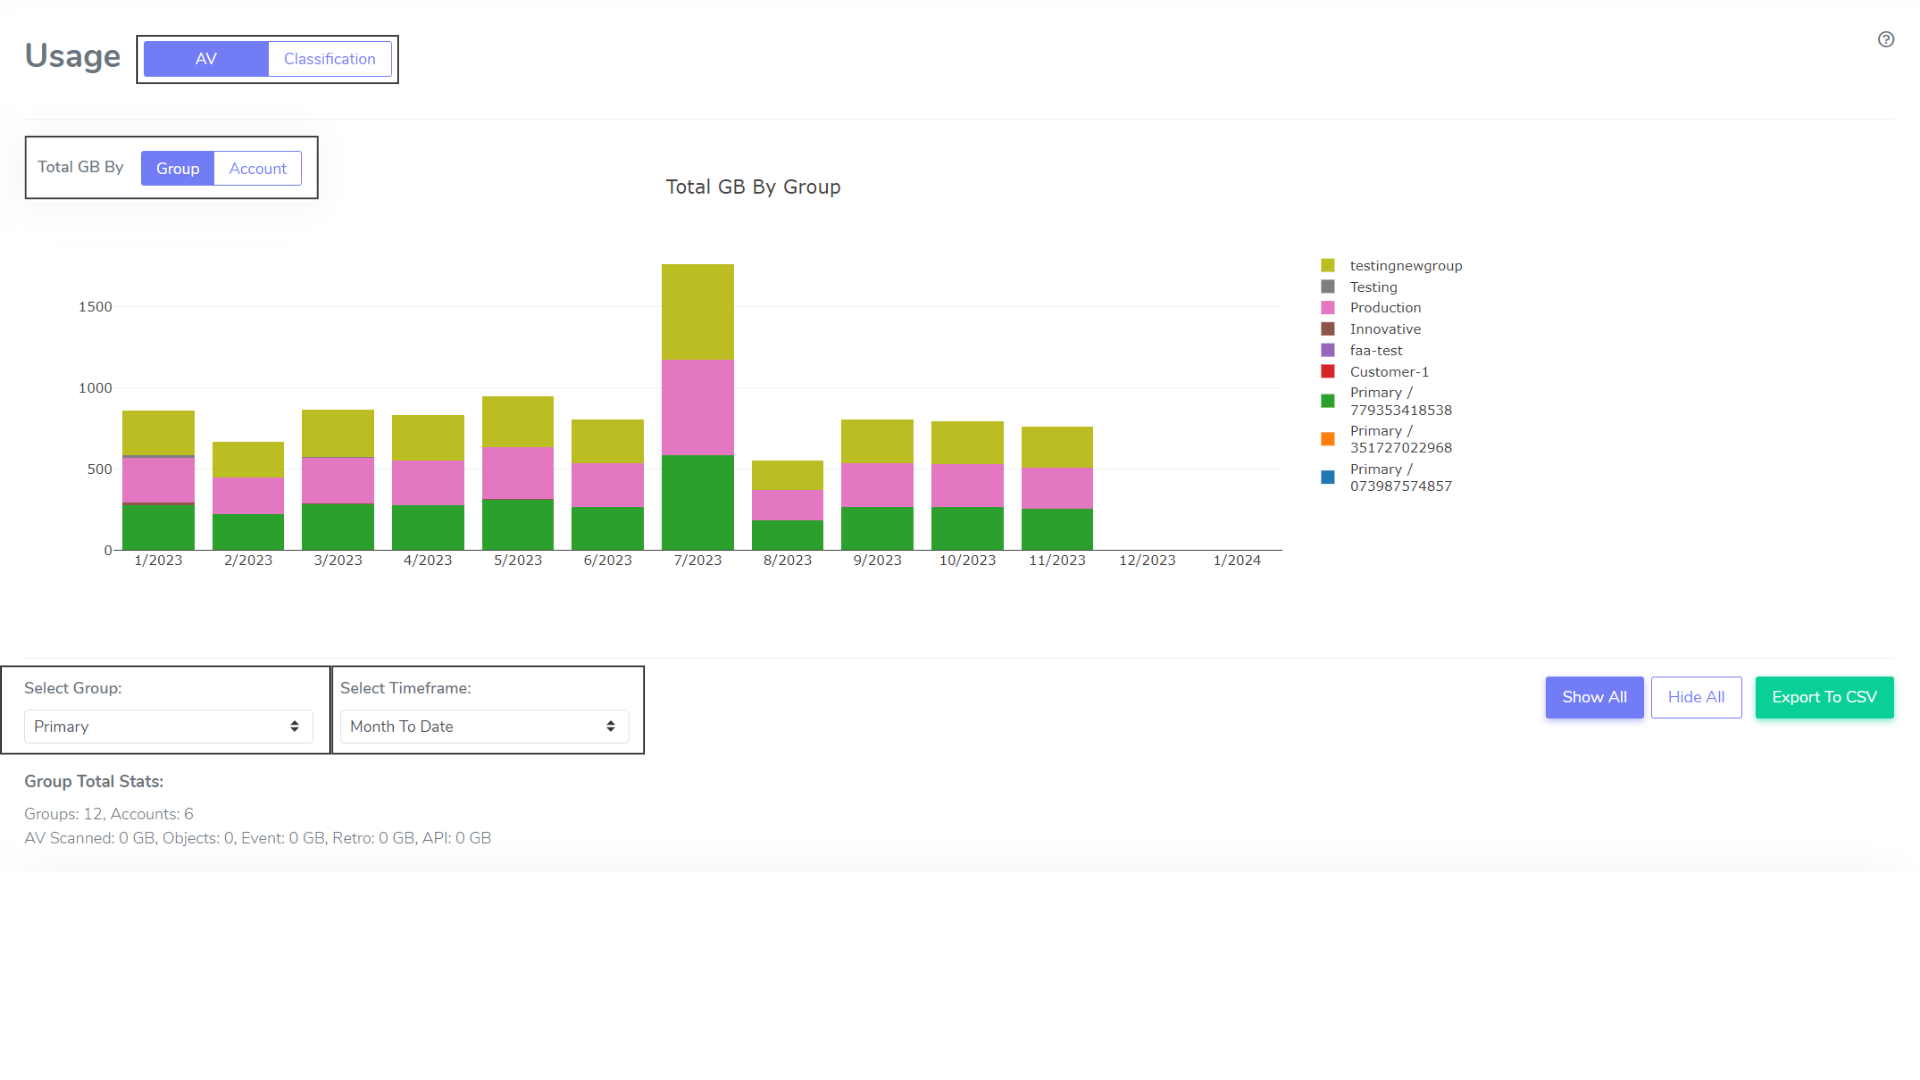
Figure 4. Usage chart in CSS console.
The usage chart, whose breakdowns can be organized by group or account using the buttons above the chart on the left, show the total amount of GBs scanned per selected unit of time. The data displayed on the entire Usage page can be filtered by group and timeframe, configurable below the usage chart on the left.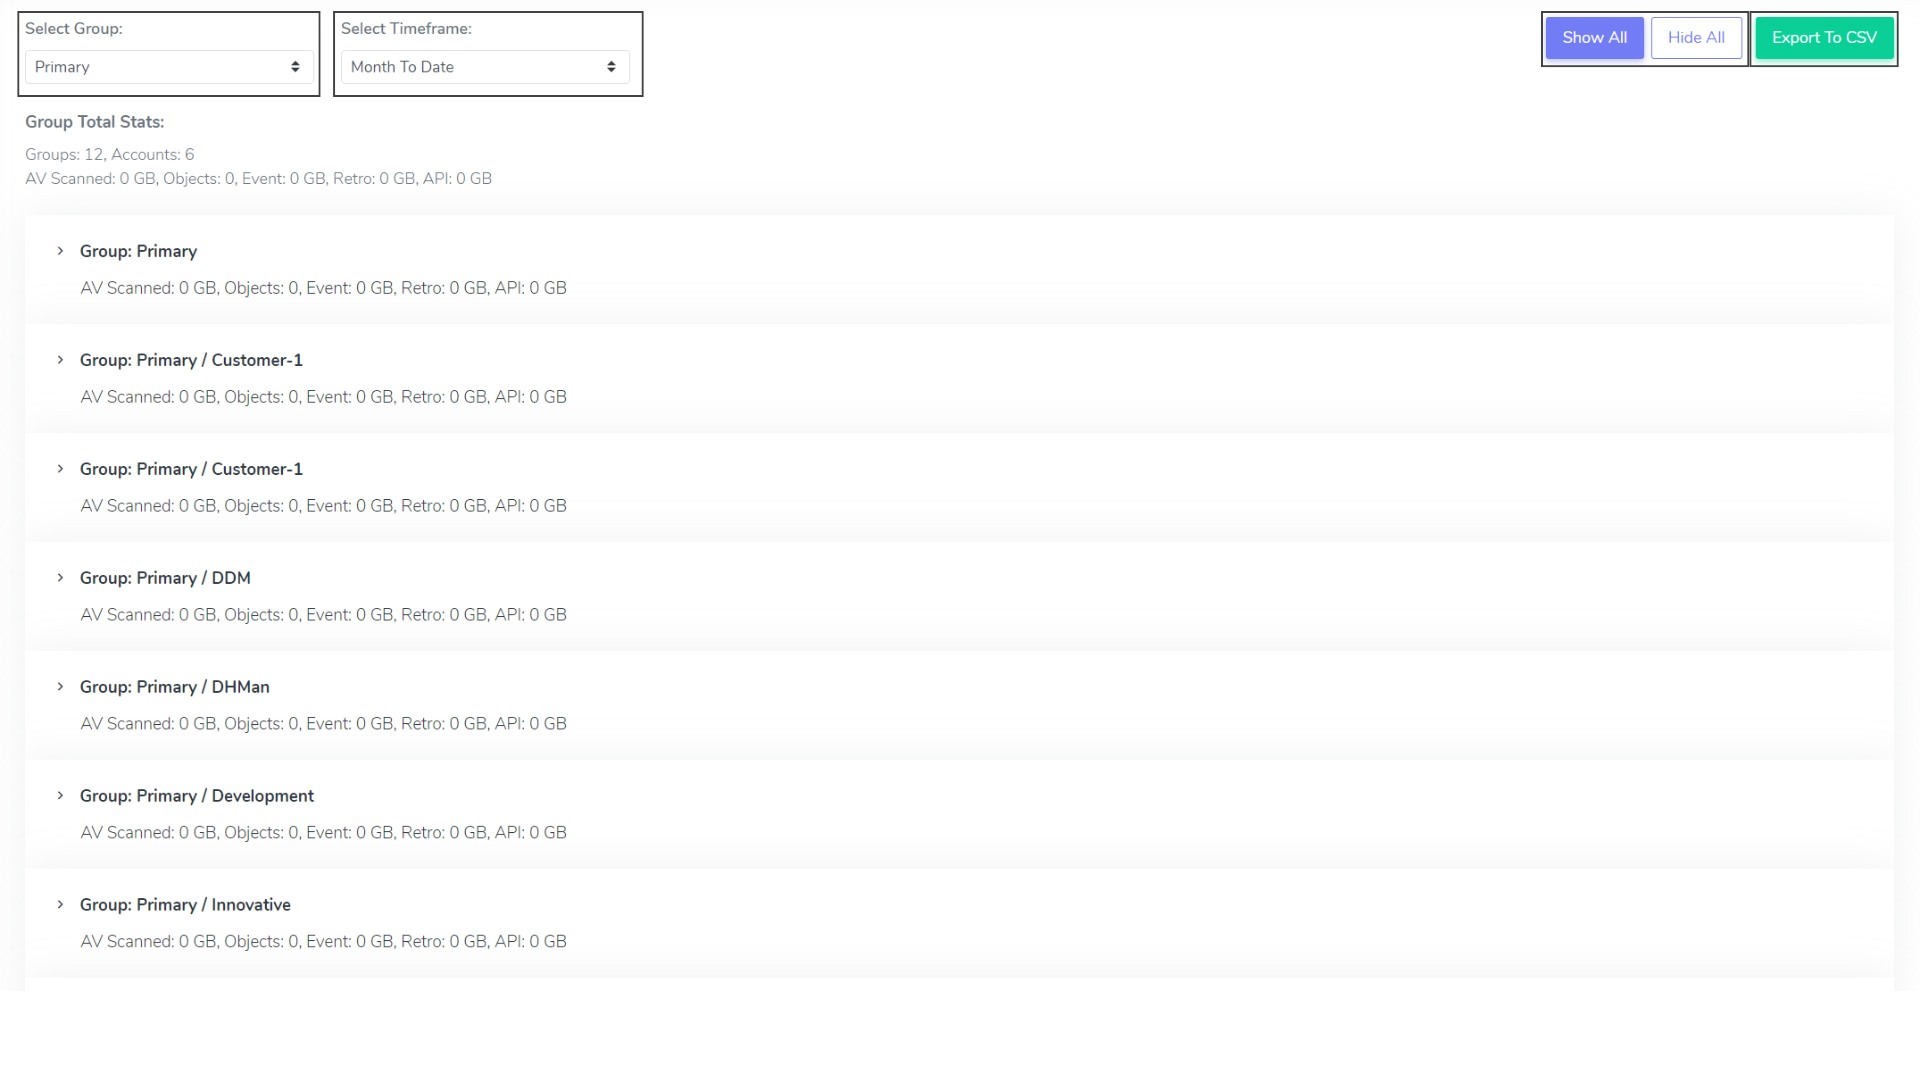
Figure 5. Usage table in CSS console.
The usage table, located below the usage chart, displays a summary of usage per group.
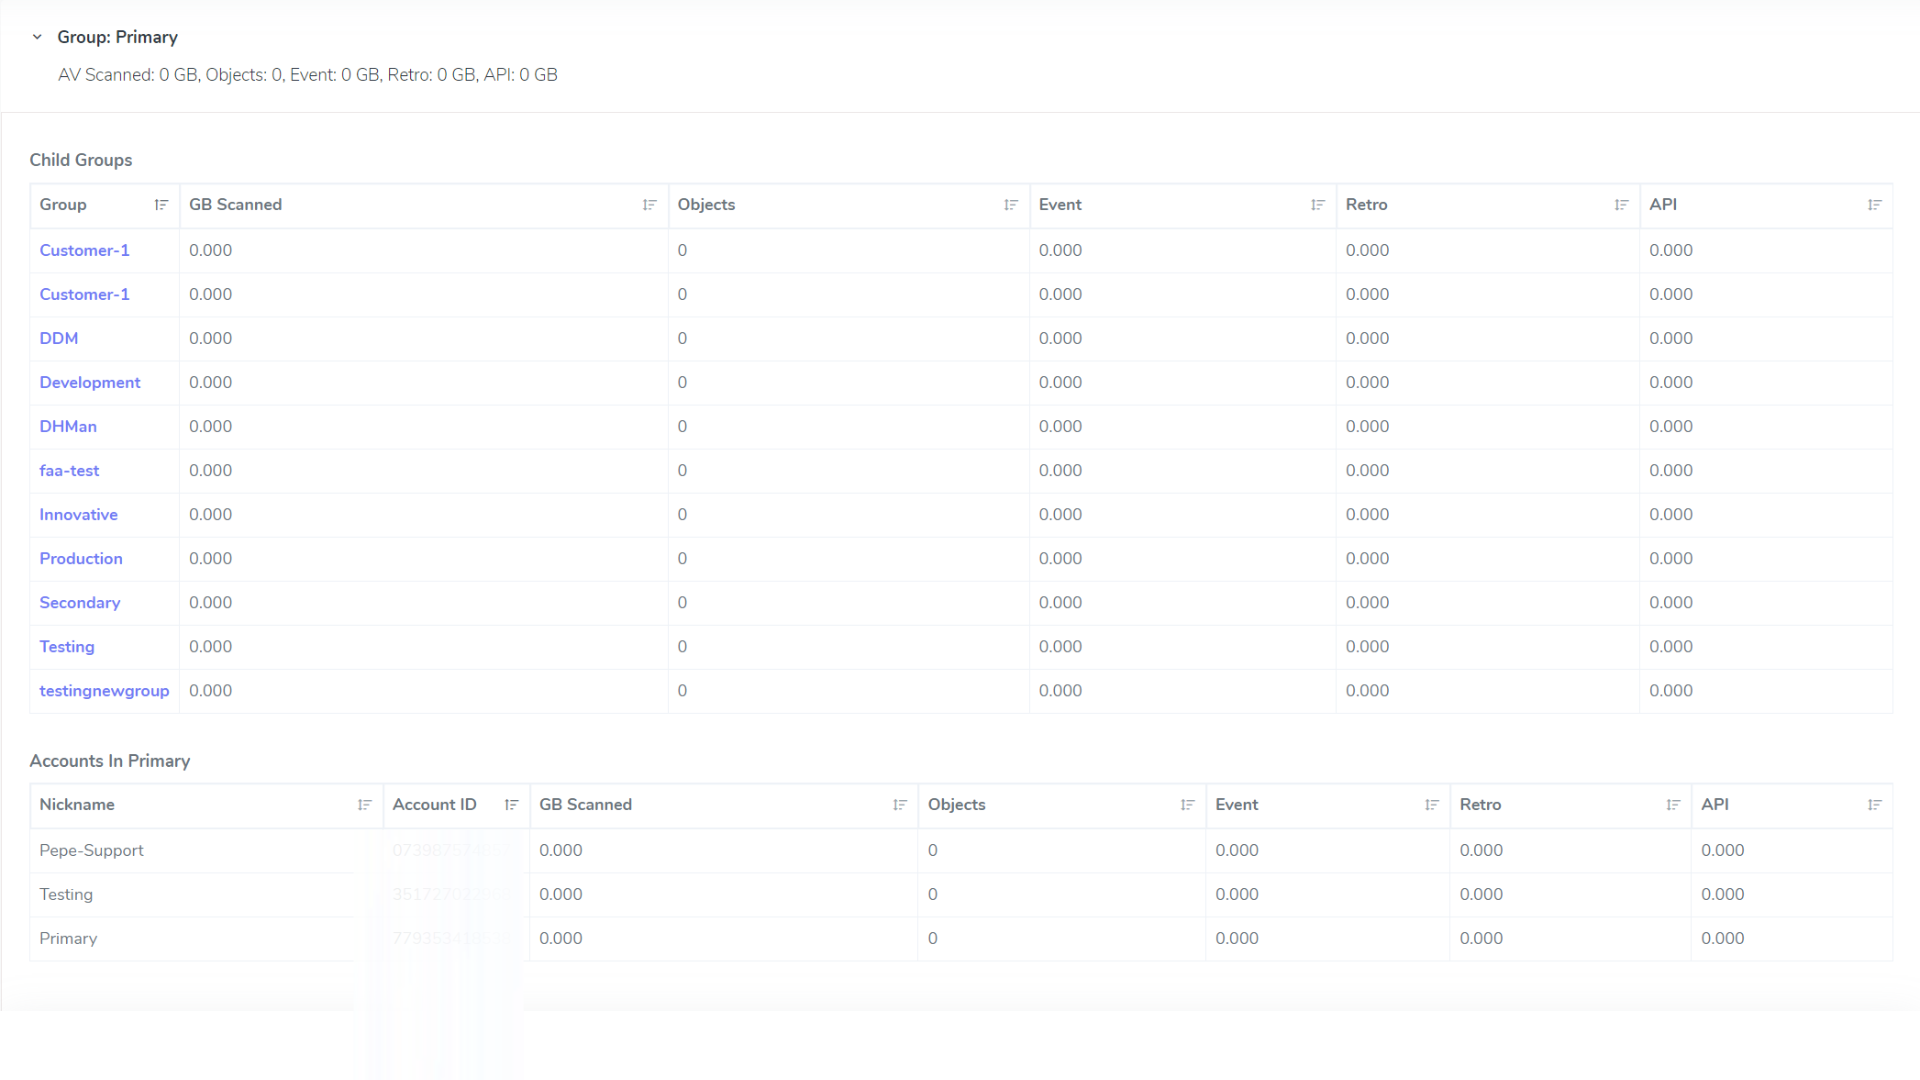
Figure 6. Expanded usage summary in CSS console.
To drill down into a usage summary of child groups and accounts within a displayed group, click anywhere on the parent group’s pane.
The data within the Usage page can be exported to .csv format using the “Export To CSV” button below the usage chart on the right.
Problem Files
The Problem Files page may have a different name in the navigation menu, depending on which CSS solutions you are currently using:
- AV: Problem Files
- DC: Classification Results
- AV and DC: Findings (collection of Infected, Unscannable and Error files)
In any case, the Problem Files page allows you to filter and identify individual objects to view the object name, scanning method, location, result, and any measures taken by the console to quarantine or delete the file.
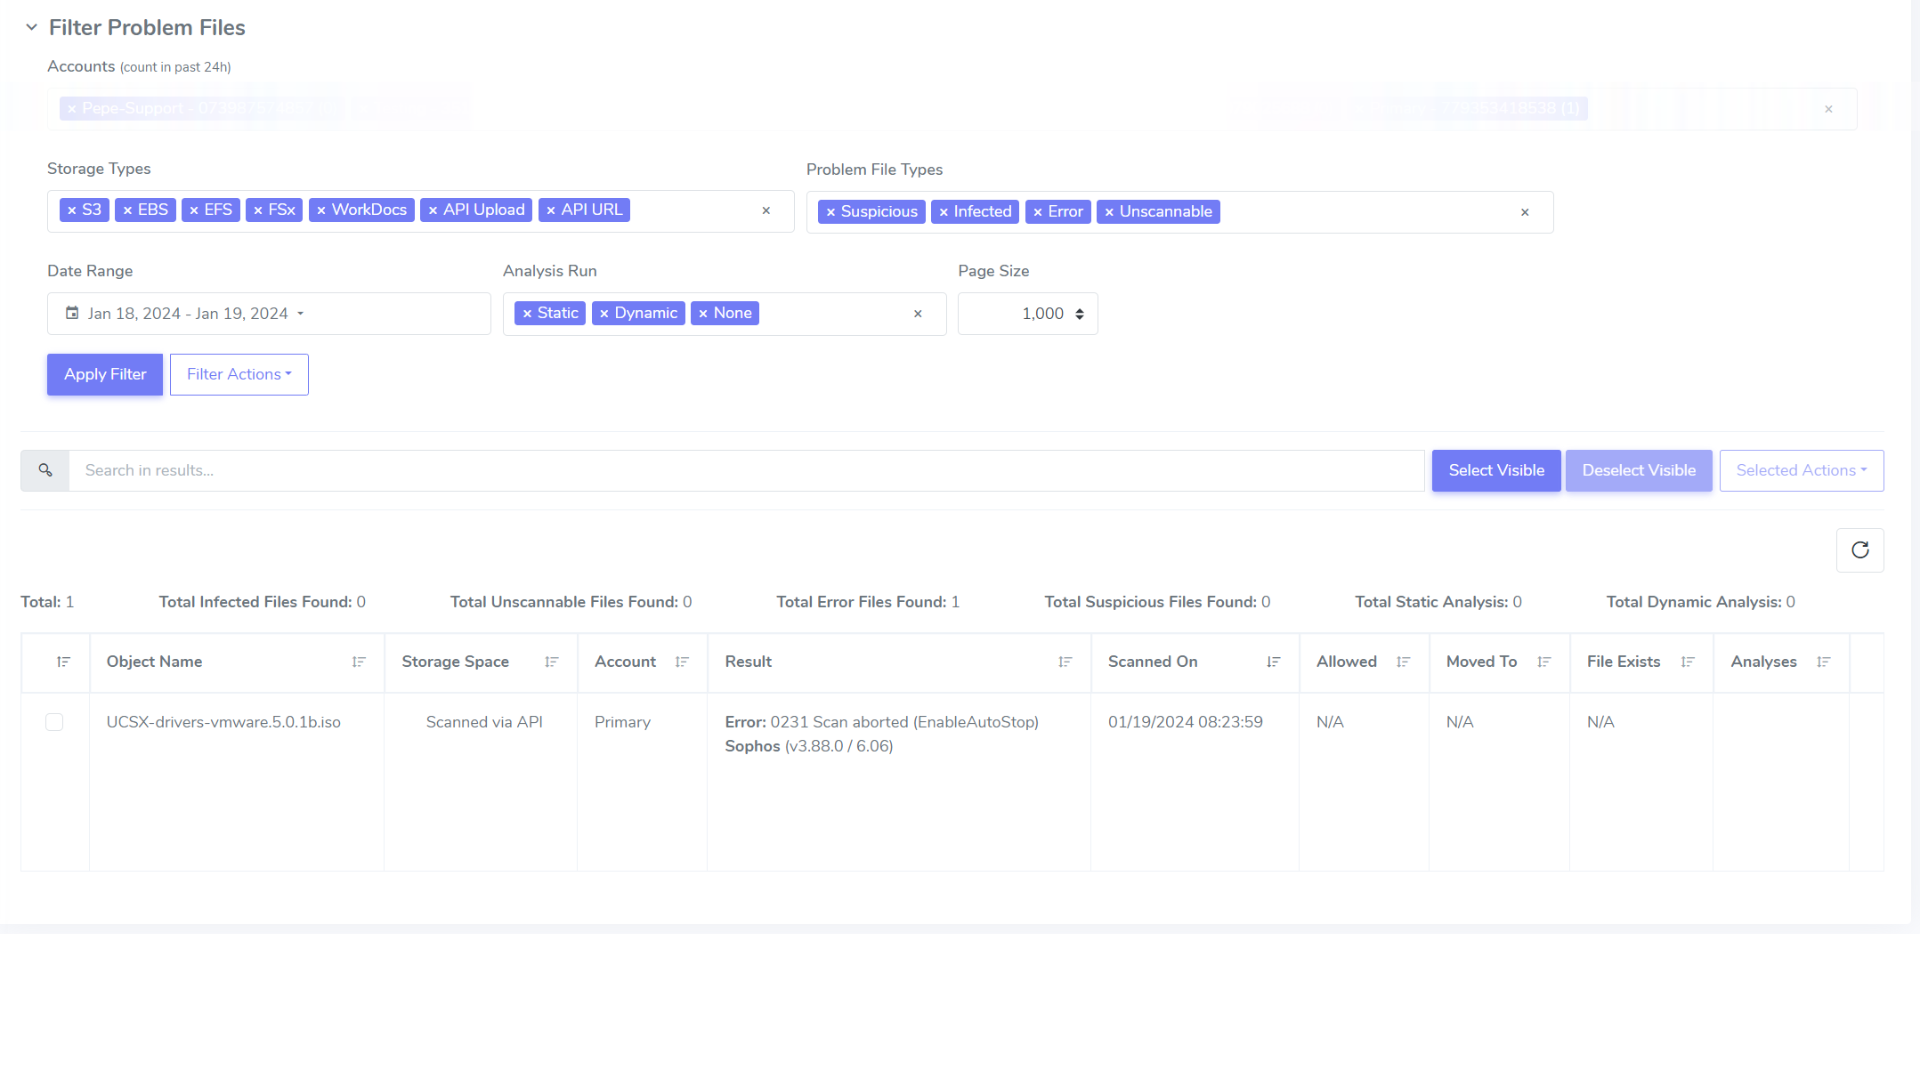
Figure 7. Problem Files page in CSS console.
To begin seeing results, you must set filters for the accounts, storage types, problem file types, date range, and whether or not a static or dynamic analysis has been run.
Jobs
The Jobs page allows you to view the results of individual jobs. To start seeing data, select an account, date range and job status(es) and hit “Apply Filter”.
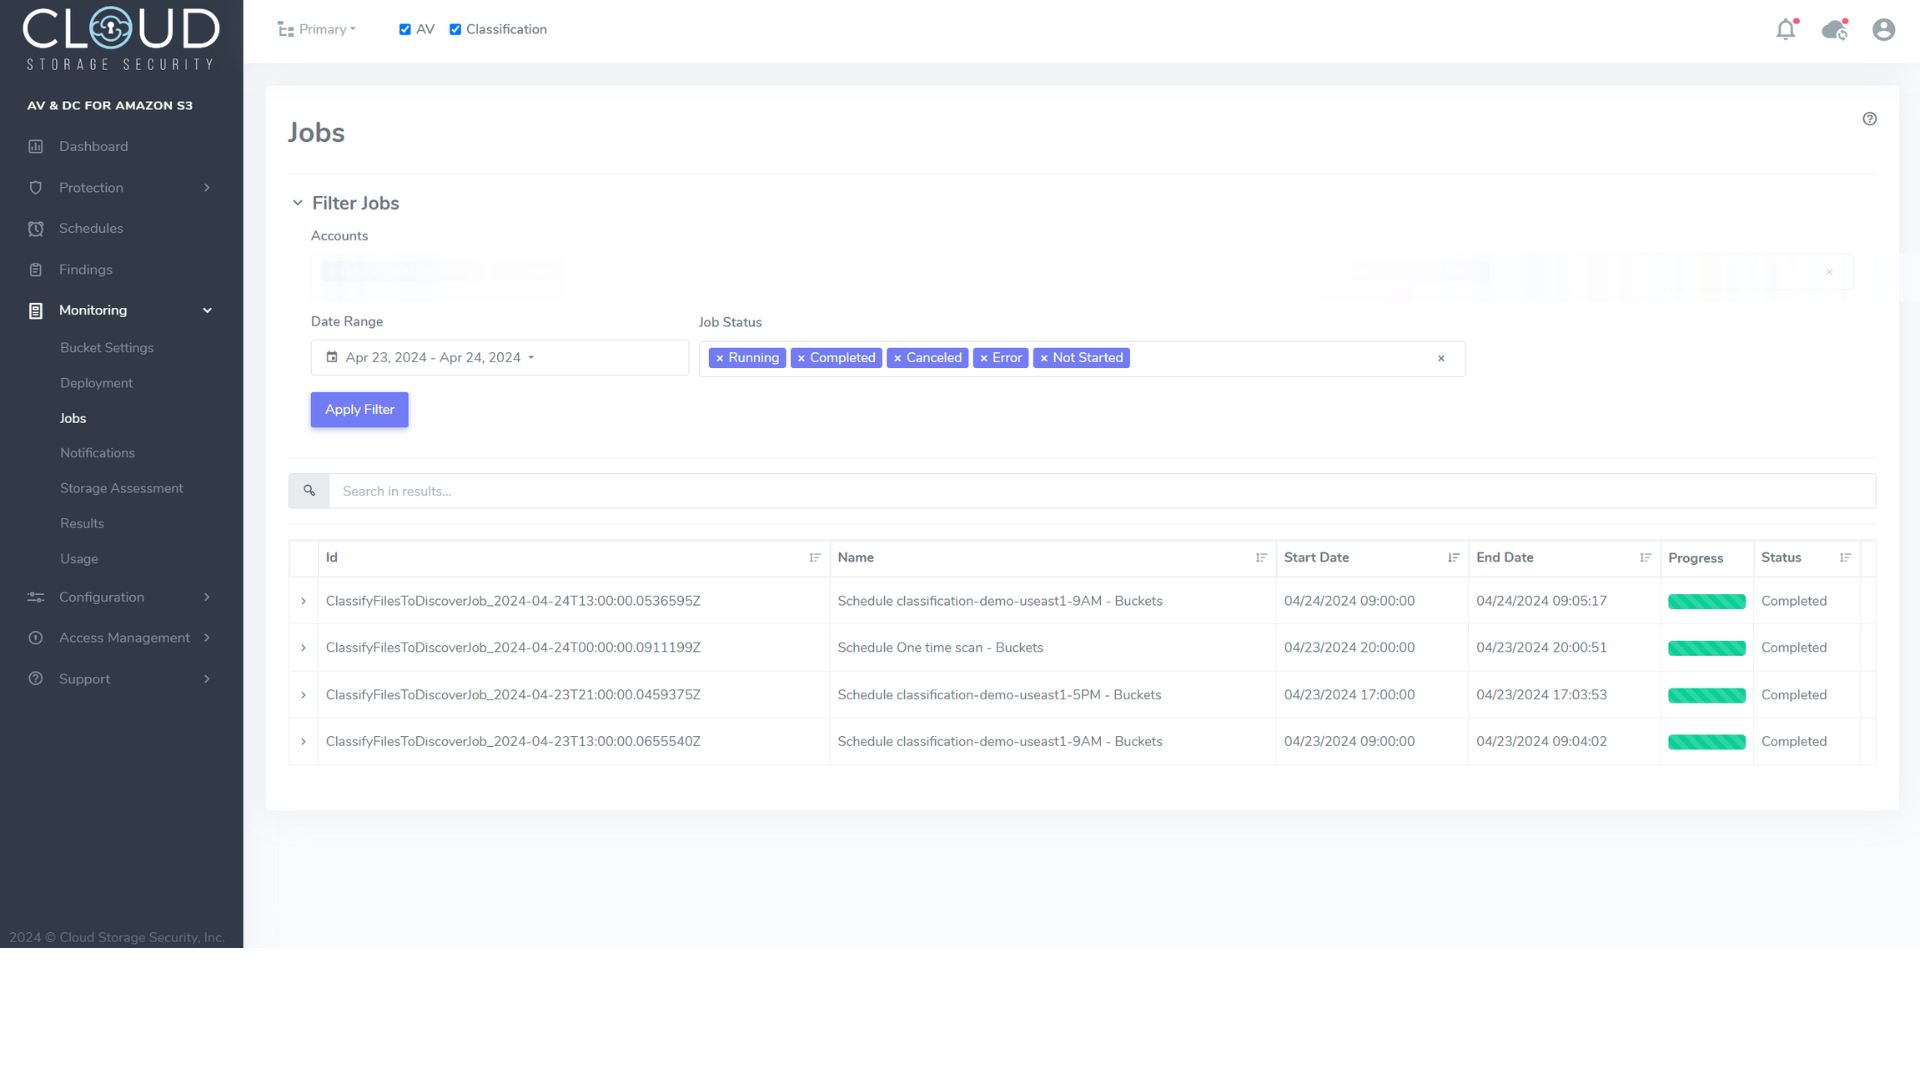
Figure 8. Jobs page in CSS console.
If you’d like to see more information about a particular job, click on the drop down to the left of the Job ID and click the “Details” button.
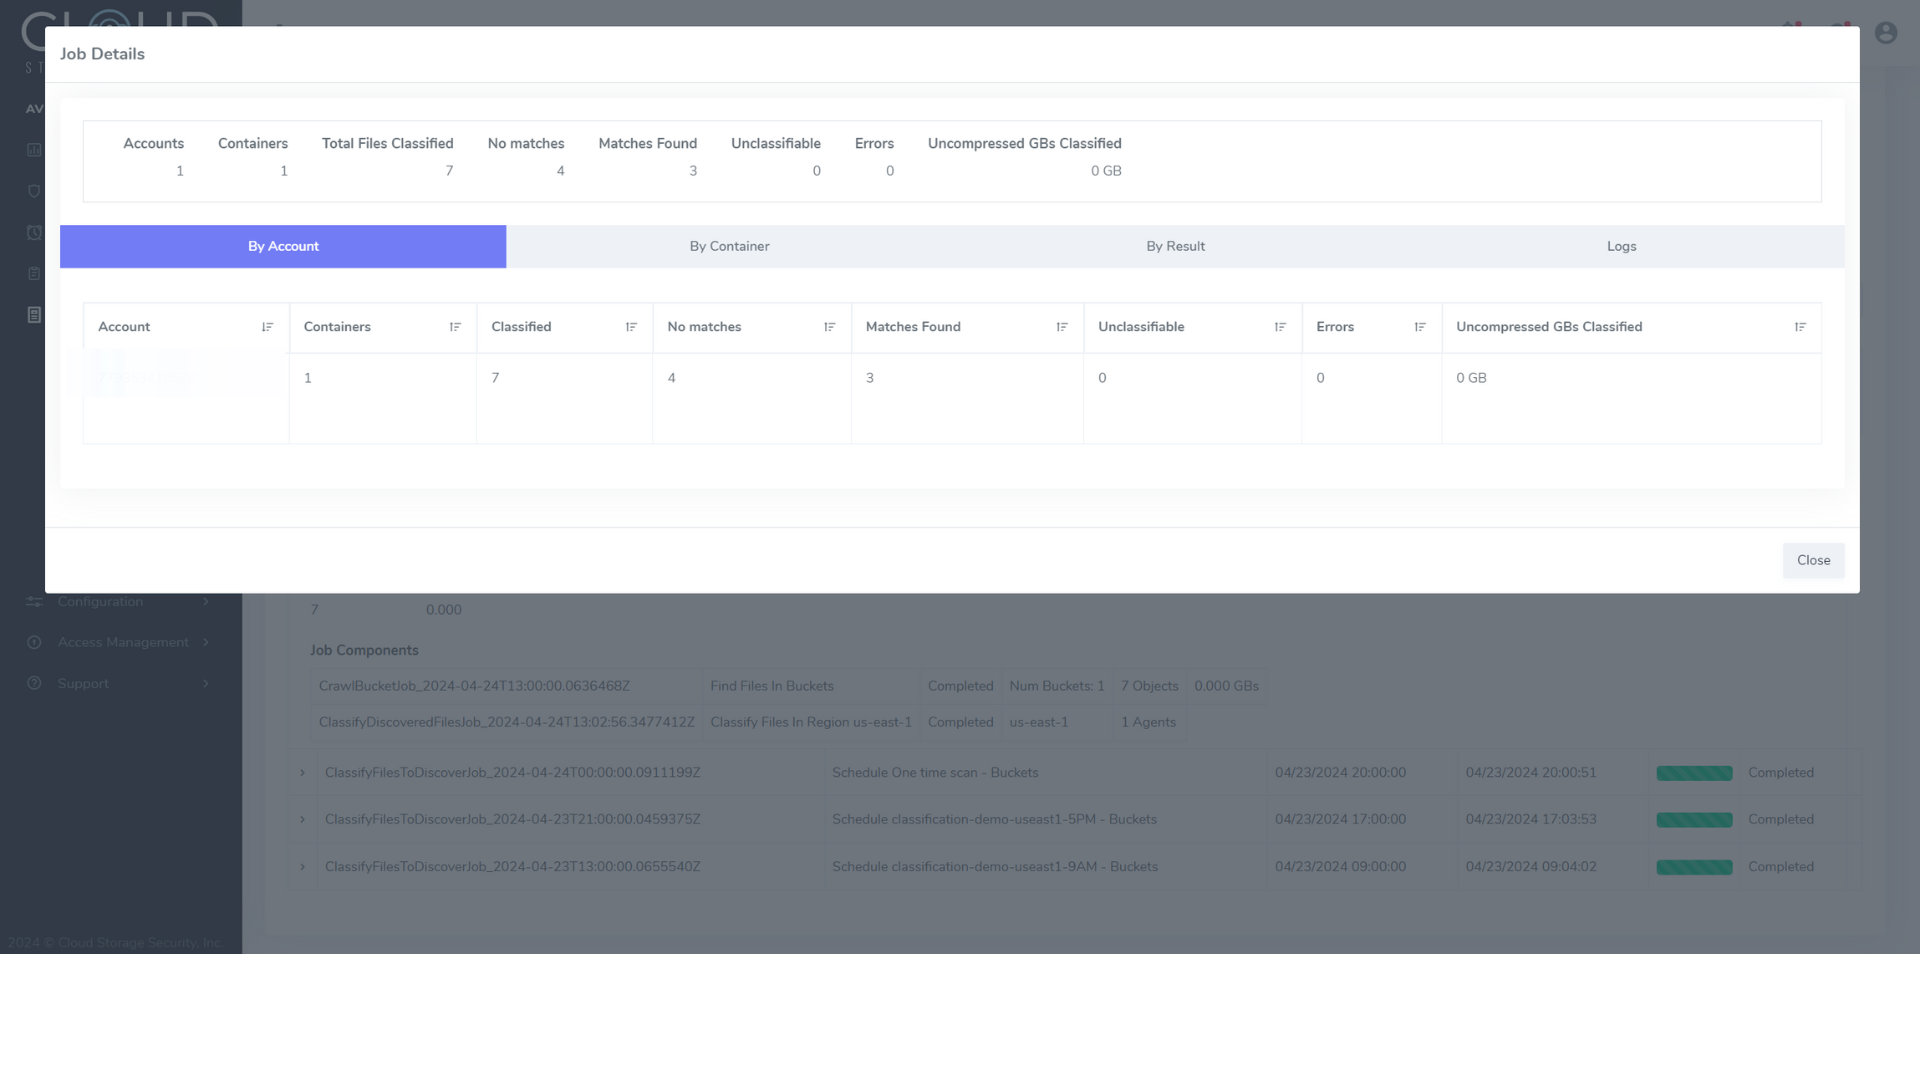
Figure 9. Job Details popup in CSS console.
The popup will appear, displaying job results such as total files scanned, problem files, and infected/matches found. These results can also be organized by account, container, or result using the buttons below the job summary.
Notifications
For times when you are not in front of your CSS console, proactive notifications work great for alerting you of important and system-critical events that take place within the deployment and scanning environment. An overview of notifications, including how to create them, can be found on our Help Docs.
Storage Assessment
The Storage Assessment page gives users the ability to look deeper into the state of their Amazon S3 storage environment across buckets, regions, groups, accounts, and more. To enable or disable Storage Assessment functionalities, follow this guide.
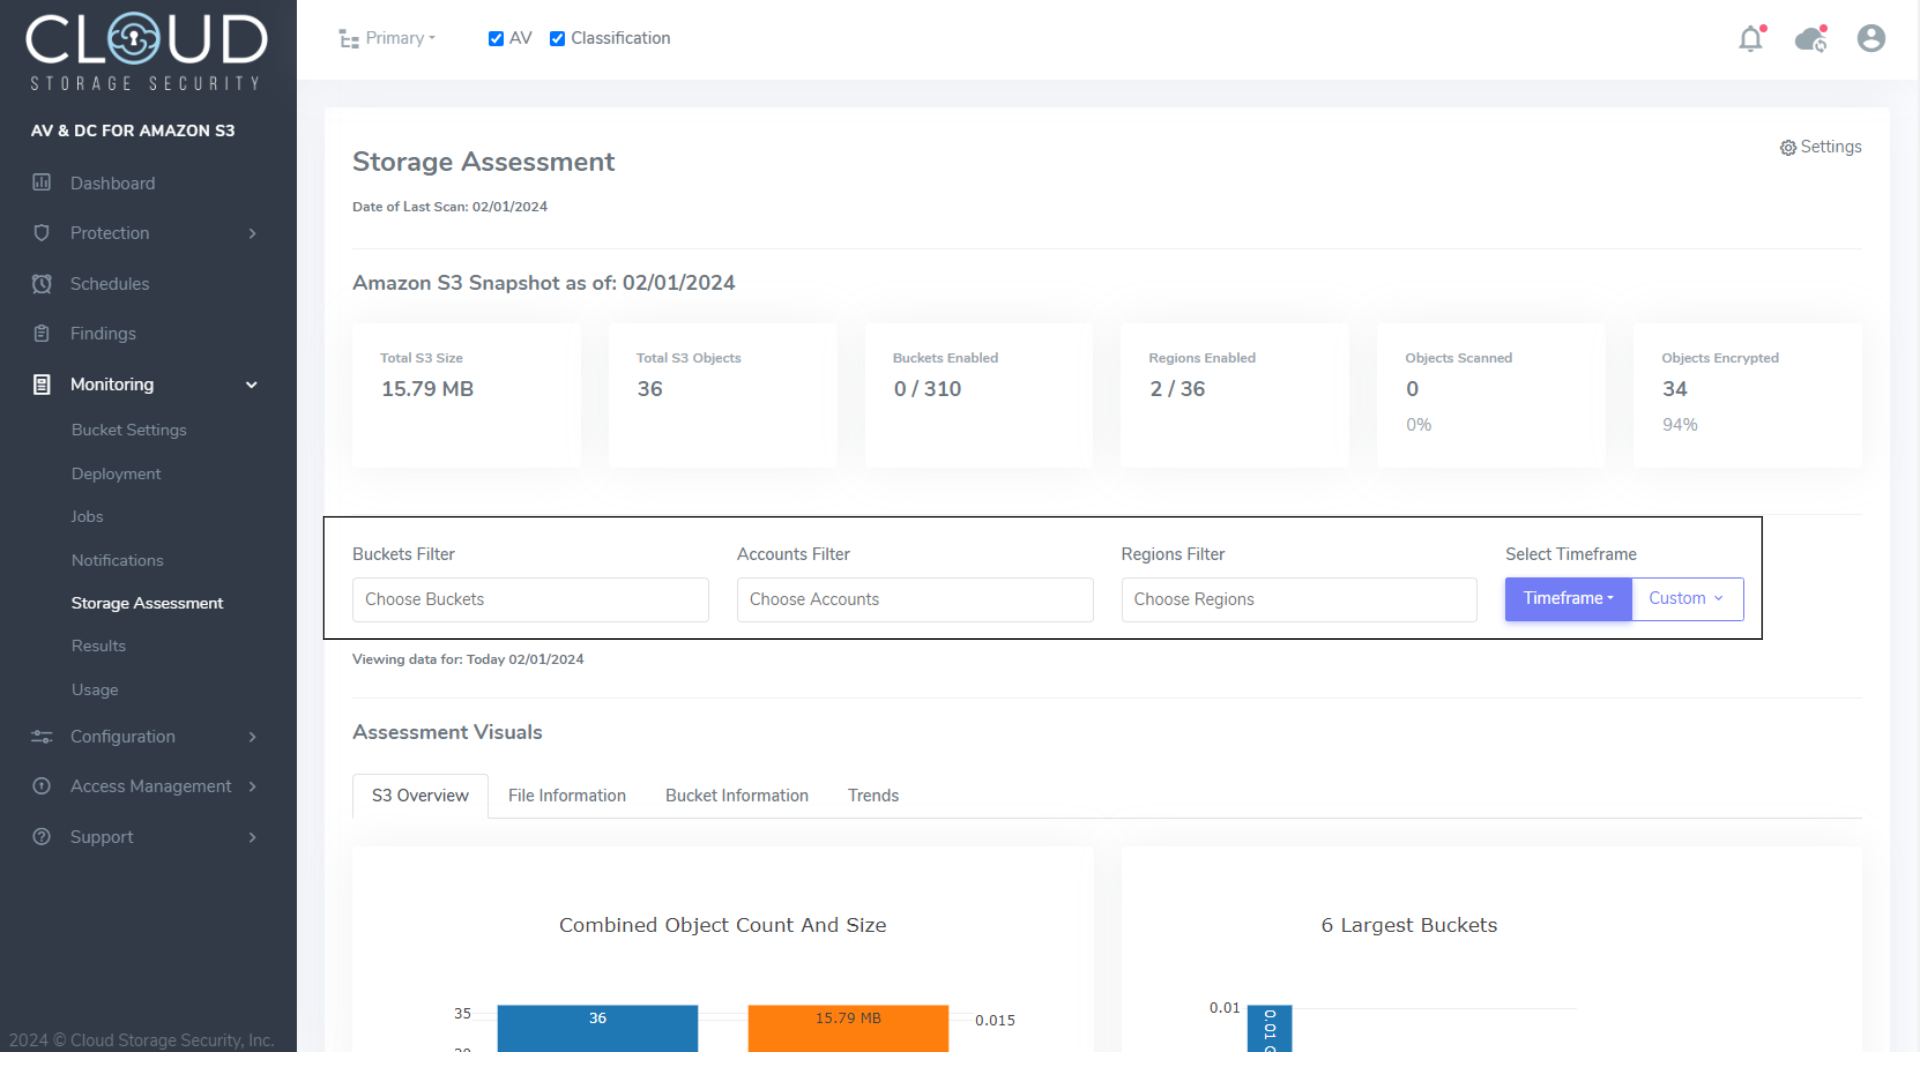
Figure 10. Storage Assessment page in CSS console.
The Storage Assessment page contains a snapshot of the total volume and number of objects stored in Amazon S3, the amount of objects scanned and encrypted, and more. Below the snapshot are the Assessment Visuals, which allow users to access more detailed information covering average bucket size, total bucket count, data volumes over time, and more. The entire page can be filtered by bucket, account, region, and time by editing the fields below the snapshot.
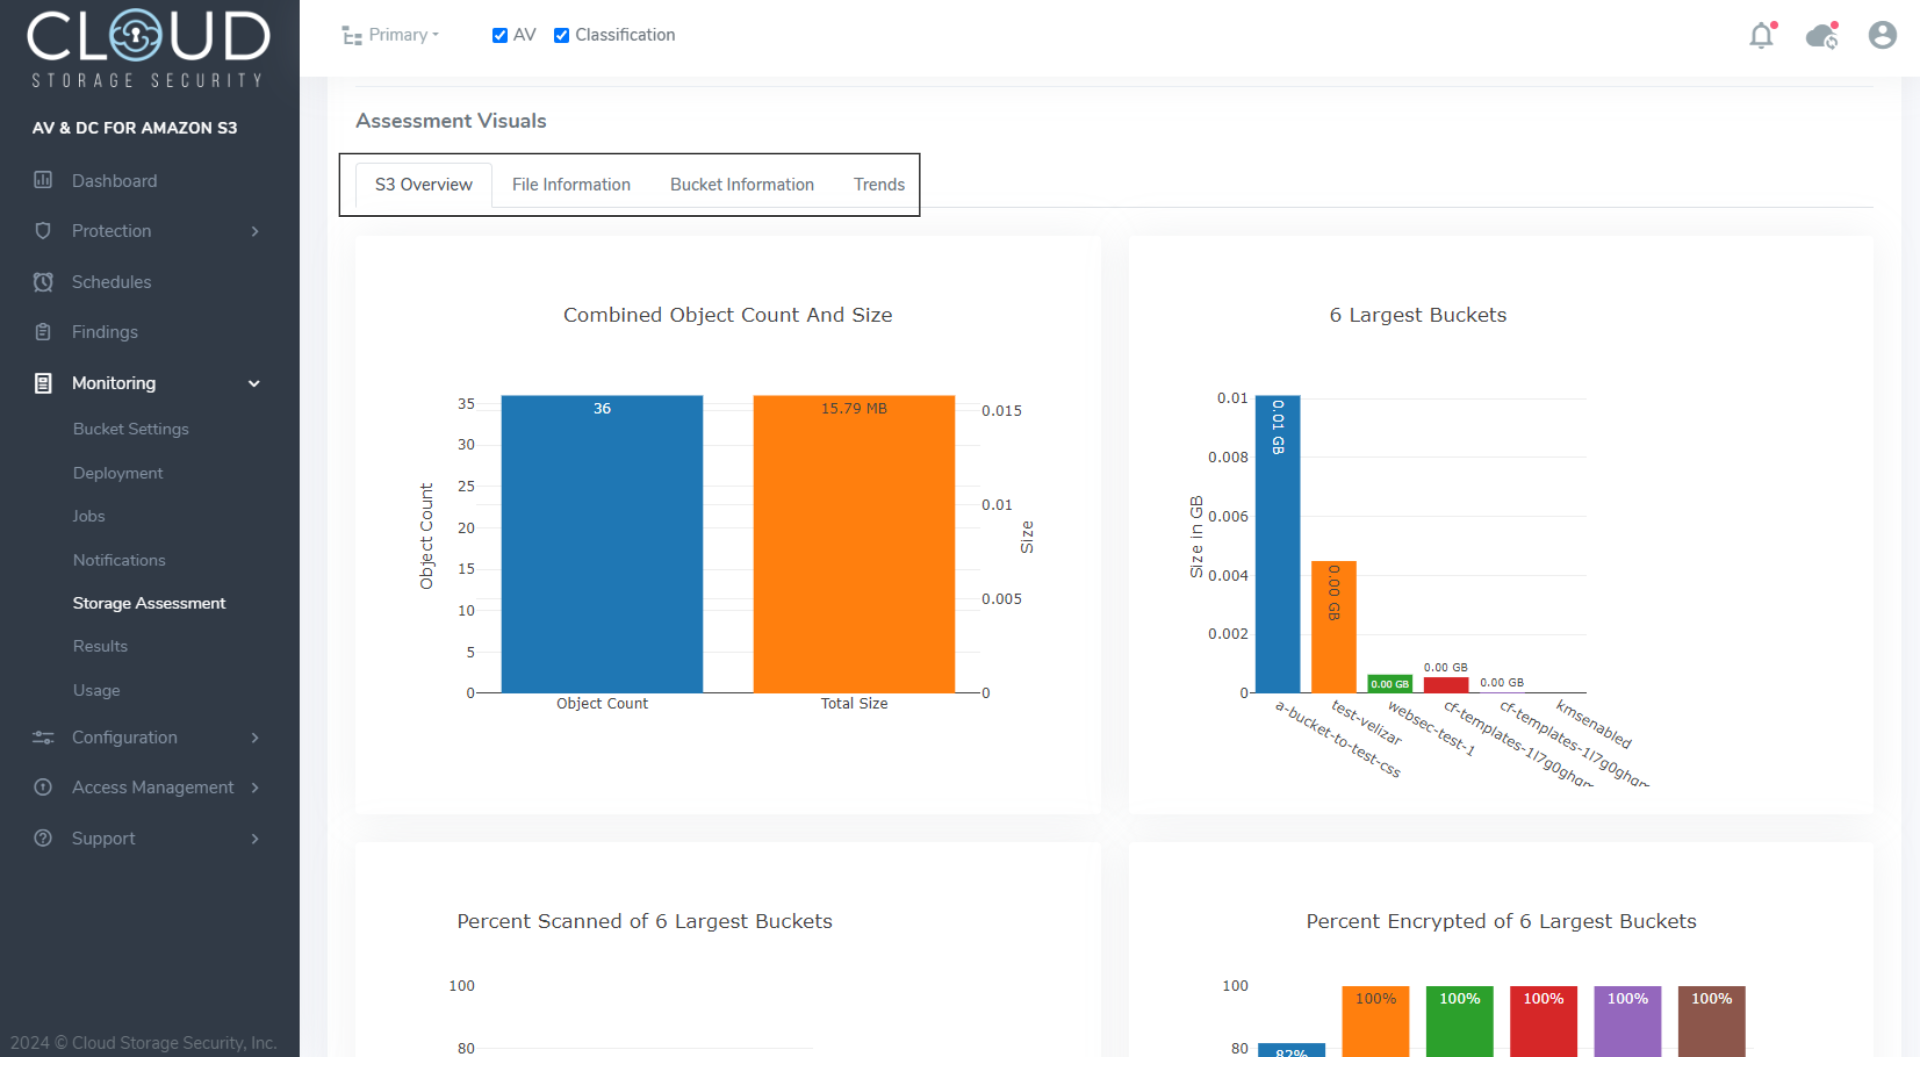
Figure 11. Assessment Visuals charts on the Storage Assessment page.
The Assessment Visuals charts can display a different set of visualizations depending on the selected tab. To switch between views, use the tabs above the charts.
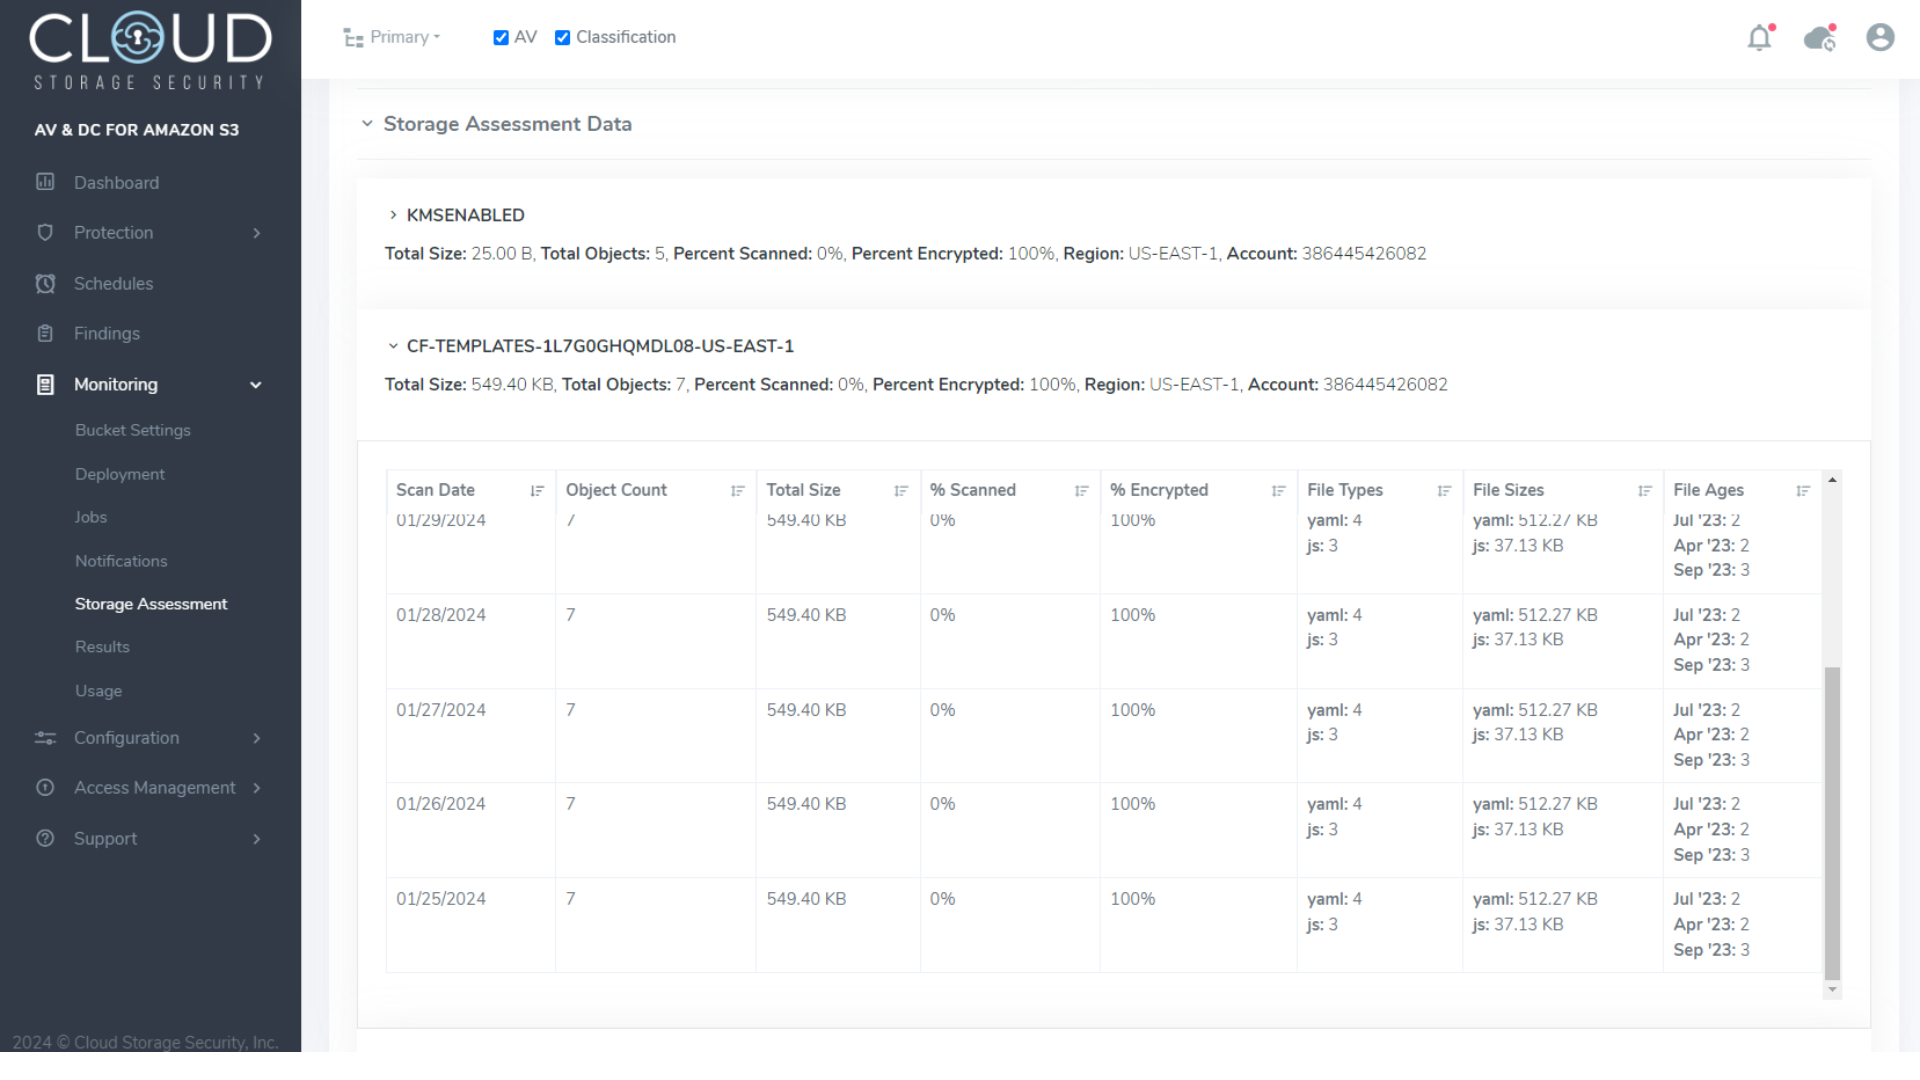
Figure 12. Storage Assessment Data on Storage Assessment page.
Detailed information on individual buckets can be viewed below the Assessment Visuals charts. To view more information about a particular bucket, including last scanned date, object count and total size over time, and file composition, click anywhere on an individual bucket’s pane.
More Resources
More detailed information on our console’s reporting capabilities, as well as information about deployment, configuration, and more, are available on our Help Docs. As always, contact us if you have any questions concerning our solutions or are looking for discounted pricing.
.svg)